
firemaps.net provides fire information from satellites.
We support fire management planning through information on burned area, biomass burned and smoke emissions, as well as on the timing of the fires. We derive this information from satellites which regularly observe the Earth.
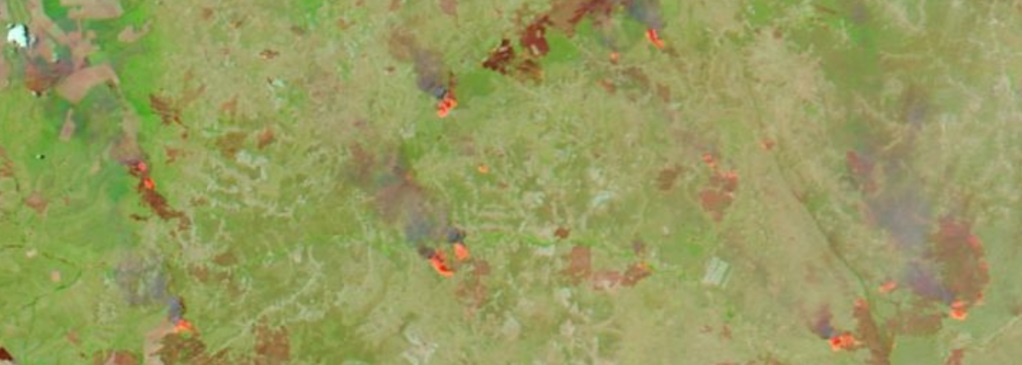
If you need to oversee and report fire activity, firemaps.net is where you can get the information to develop and support your management strategies. We provide fire information from the level of protected areas up to whole countries. firemaps.net provides you with rich information on single fires as well as summary information on your area of interest. Furthermore you have access to the latest as well as historical daily satellite images at medium resolution from the MODIS and VIIRS sensors, and to current and past Sentinel 2 and Landsat 8 data.
Get an overview of what is going on
firemaps.net provides:
- a dashboard with summary information on the fire situation in your area
- interactive web maps and online fire statisics
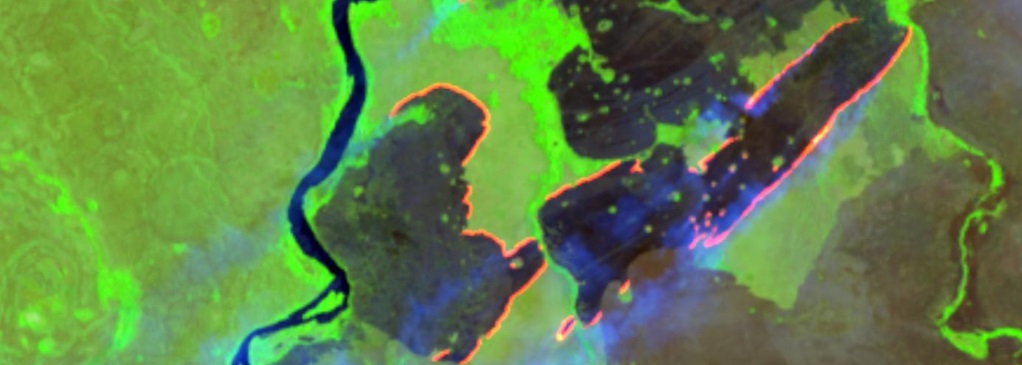
- burned area maps from Landsat and Sentinel satellites at 20/30 m resolution with weekly updates during the fire season
- active fire detections and near real time estimation of carbon emissions, updated every 15 minutes
- fire risk mapping and fire threat analysis
For each fire event, you can get a host of information:
- when was the start and end date of this fire?
- how much biomass was consumed by this fire? (total and per sqm, with error margin)
- what is the estimated amount of greenhouse gases emitted by the fire?
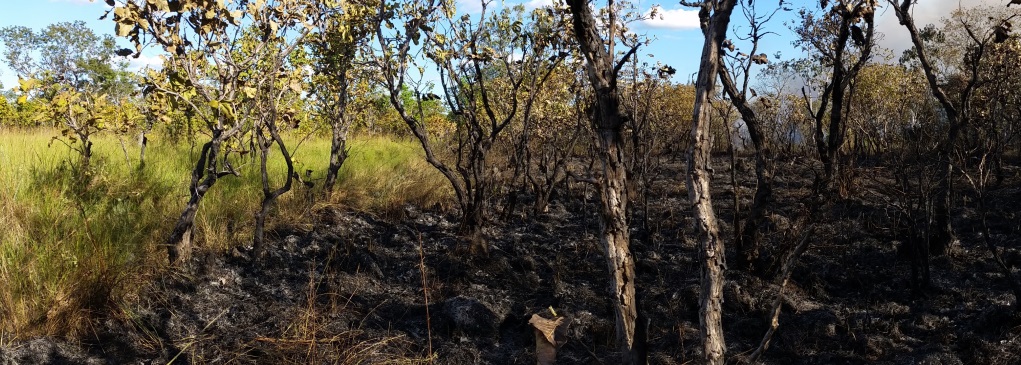
- what are the main land cover types affected?
Establish your fire baseline
We provide over ten year-long time series on fire information such as burned areas, fuel consumption and fire emissions, summed up in tabular data and graphs. Such fire and fire emissions baselines can support planning and implementation of climate mitigation action through improved fire management.