Product features
firemaps.net supports implementation of integrated fire management with data and documentation. Features include active fire detection and display, burned area mapping with frequent updates, estimation of fire emissions, fire risk and fire threat analysis, fire modelling and more…
Intuitive web interface
- Latest satellite images (MODIS, VIIRS, Landsat, Sentinel-2)
- Basemaps in various flavours
- Active fire detections from MODIS, VIIRS and Meteosat (where available) updated hourly or even every 15 minutes (Meteosat)


Burned area mapping
- With Sentinel-2 at 20 m resolution
- Timely information – provided as images become available
- Maps with colour coded information on day of burning
- Visualized with a time slider
- Original satellite images available as a backdrop
Fire emissions
- Derived from our Sentinel 2 high resolution or MODIS 500 m burned areas + heat relase measured from active fires
- Maps of burned biomass per m²
- Information on click for each fire displayed in info box or sidebar
- Chart information for each fire


Interactive statistics
- Long time series of burned areas and fire emssions help establish an emissions baseline for climate mitigation projects.
- Baseline with uncertainty margins helps assess project feasibility quickly
- Statistics on affected land cover, time of burning, comparison to management objectives, and more..
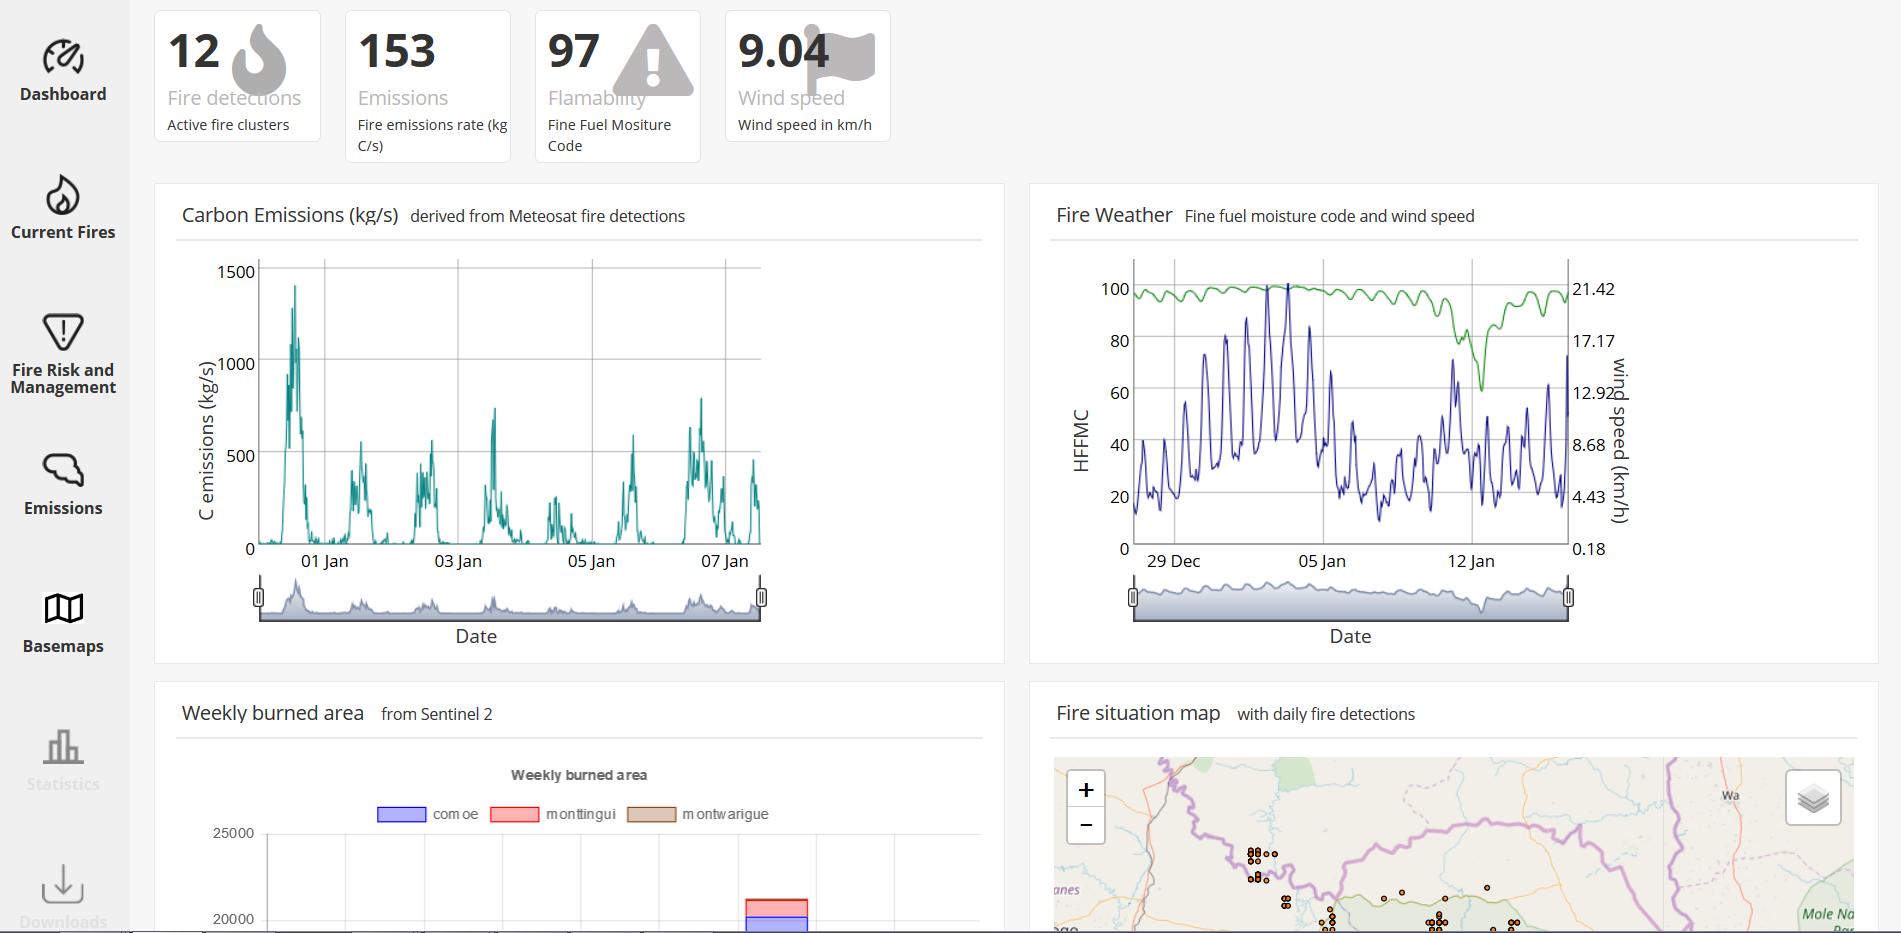
Fire Situation Dashboard
- Map with current fire situation
- Current fire activity / carbon emissions
- Fire weather information
- Current burned area information
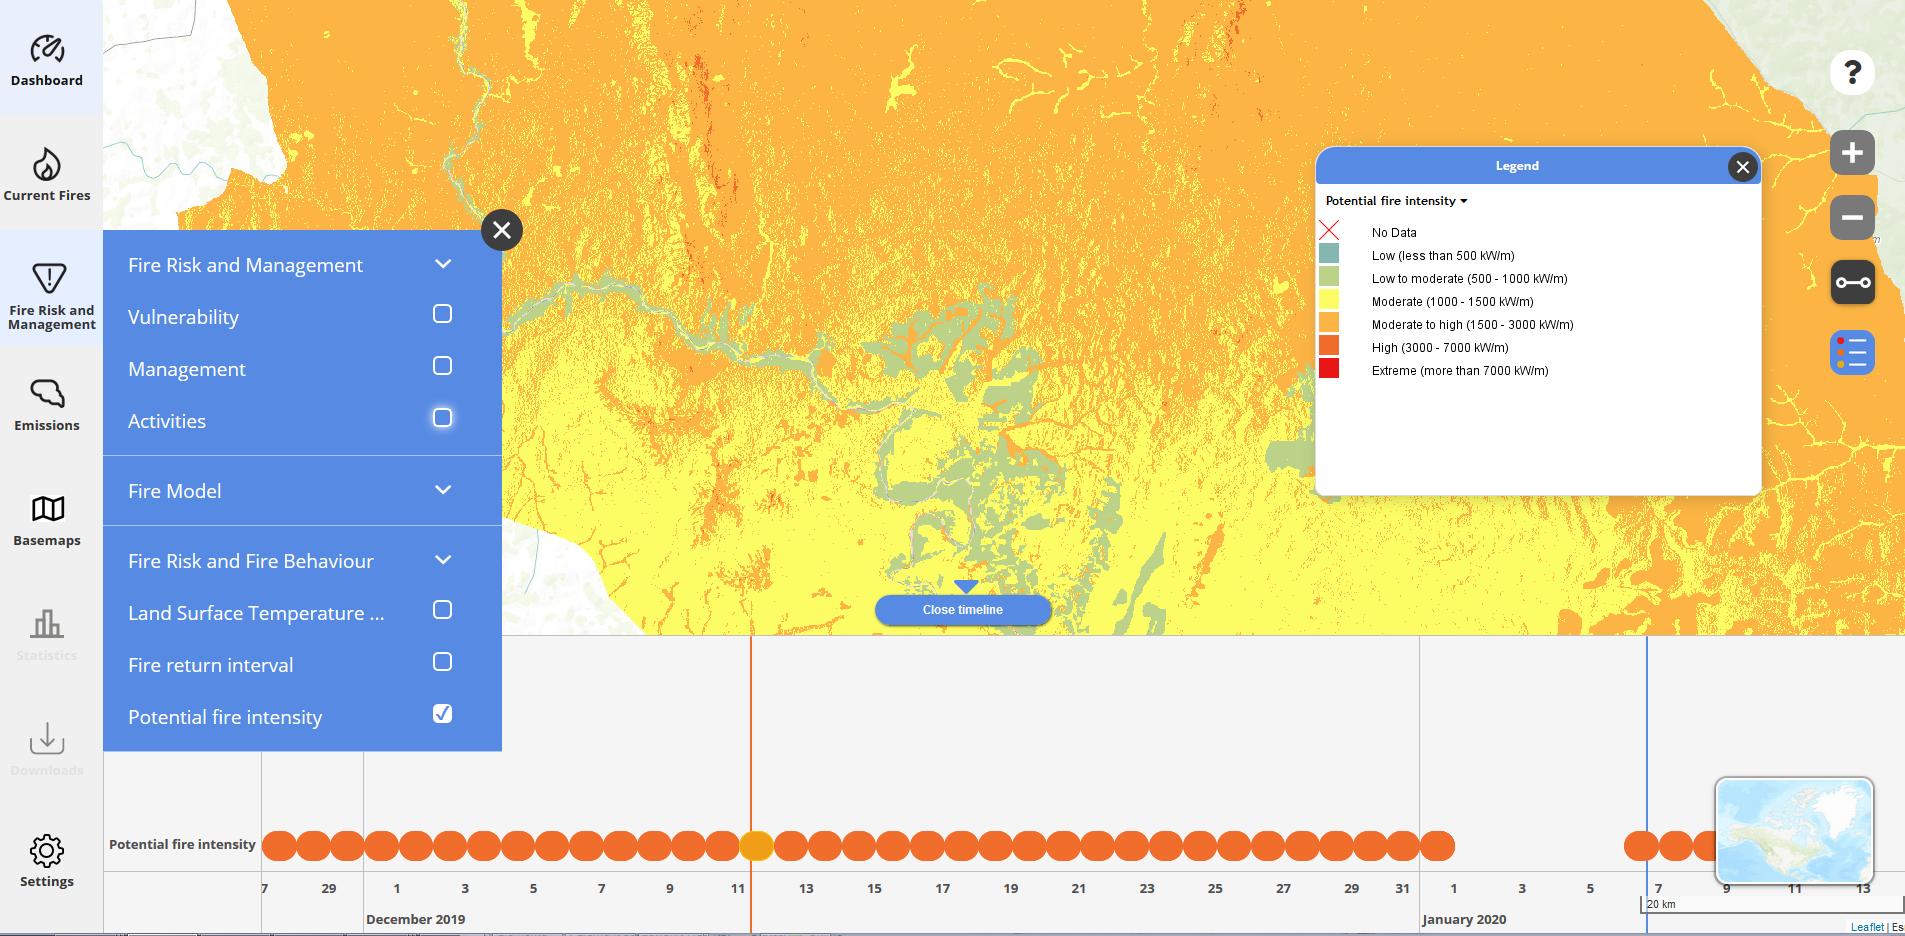
Fire risk and management support
- Vulnerablity analysis
- Management plan
- Record and analyze fire management activities
- Fire return interval
- Potential fire behaviour
- Land surface temperature
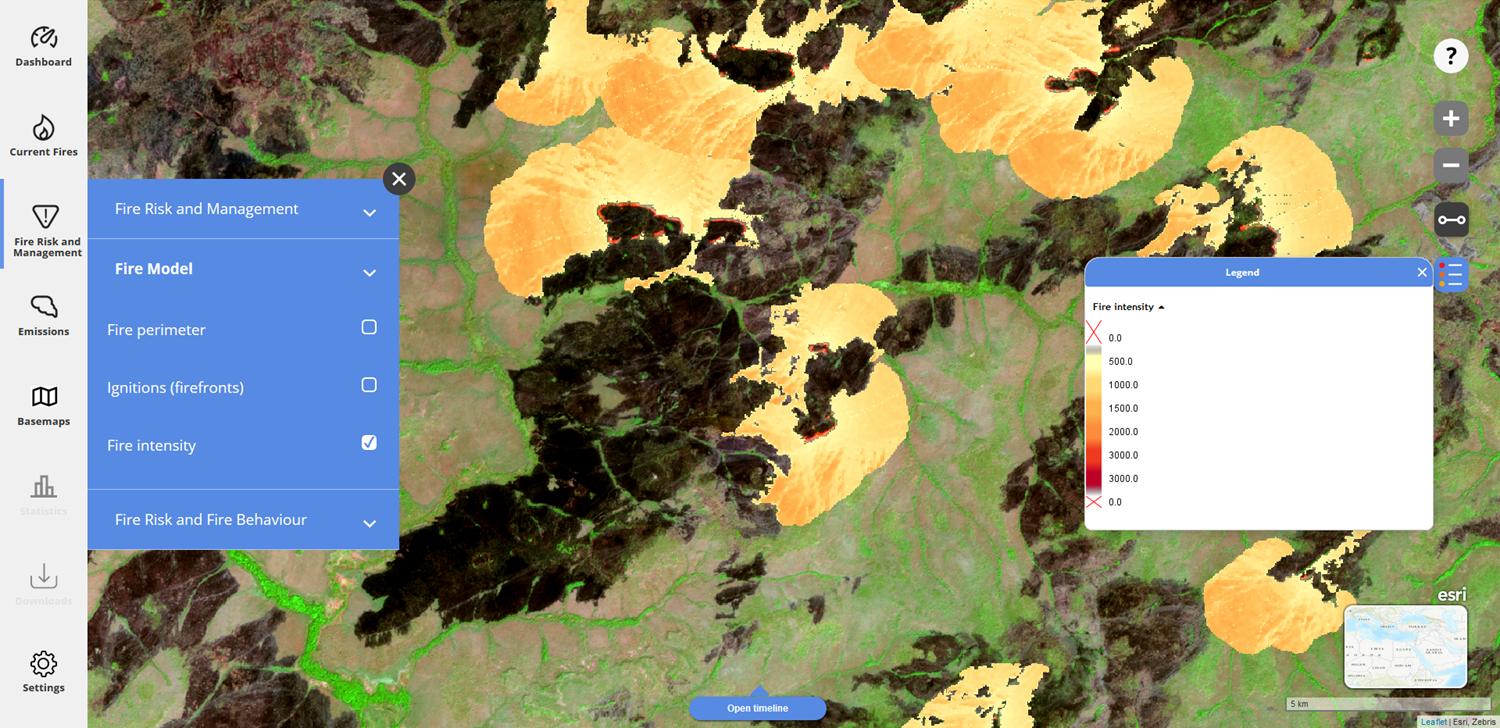
Online fire modelling (beta)
- Automated fire spread modelling
- Modelling of fire intensity and fire perimeters
- Based on satellite-detected fire fronts or user input
- Useful for fire situation analysis, planning of prescribed fires, forensic fire analysis, study of fire impacts, training and awareness.

Mobile app (beta)
The firemaps.net mobile app lets yout take firemaps to the field. Configurable mobile content can include latest satellite image, latest fire detections, fire model predictions, burned areas and more. You can record management activities in real time and sync back to the server.