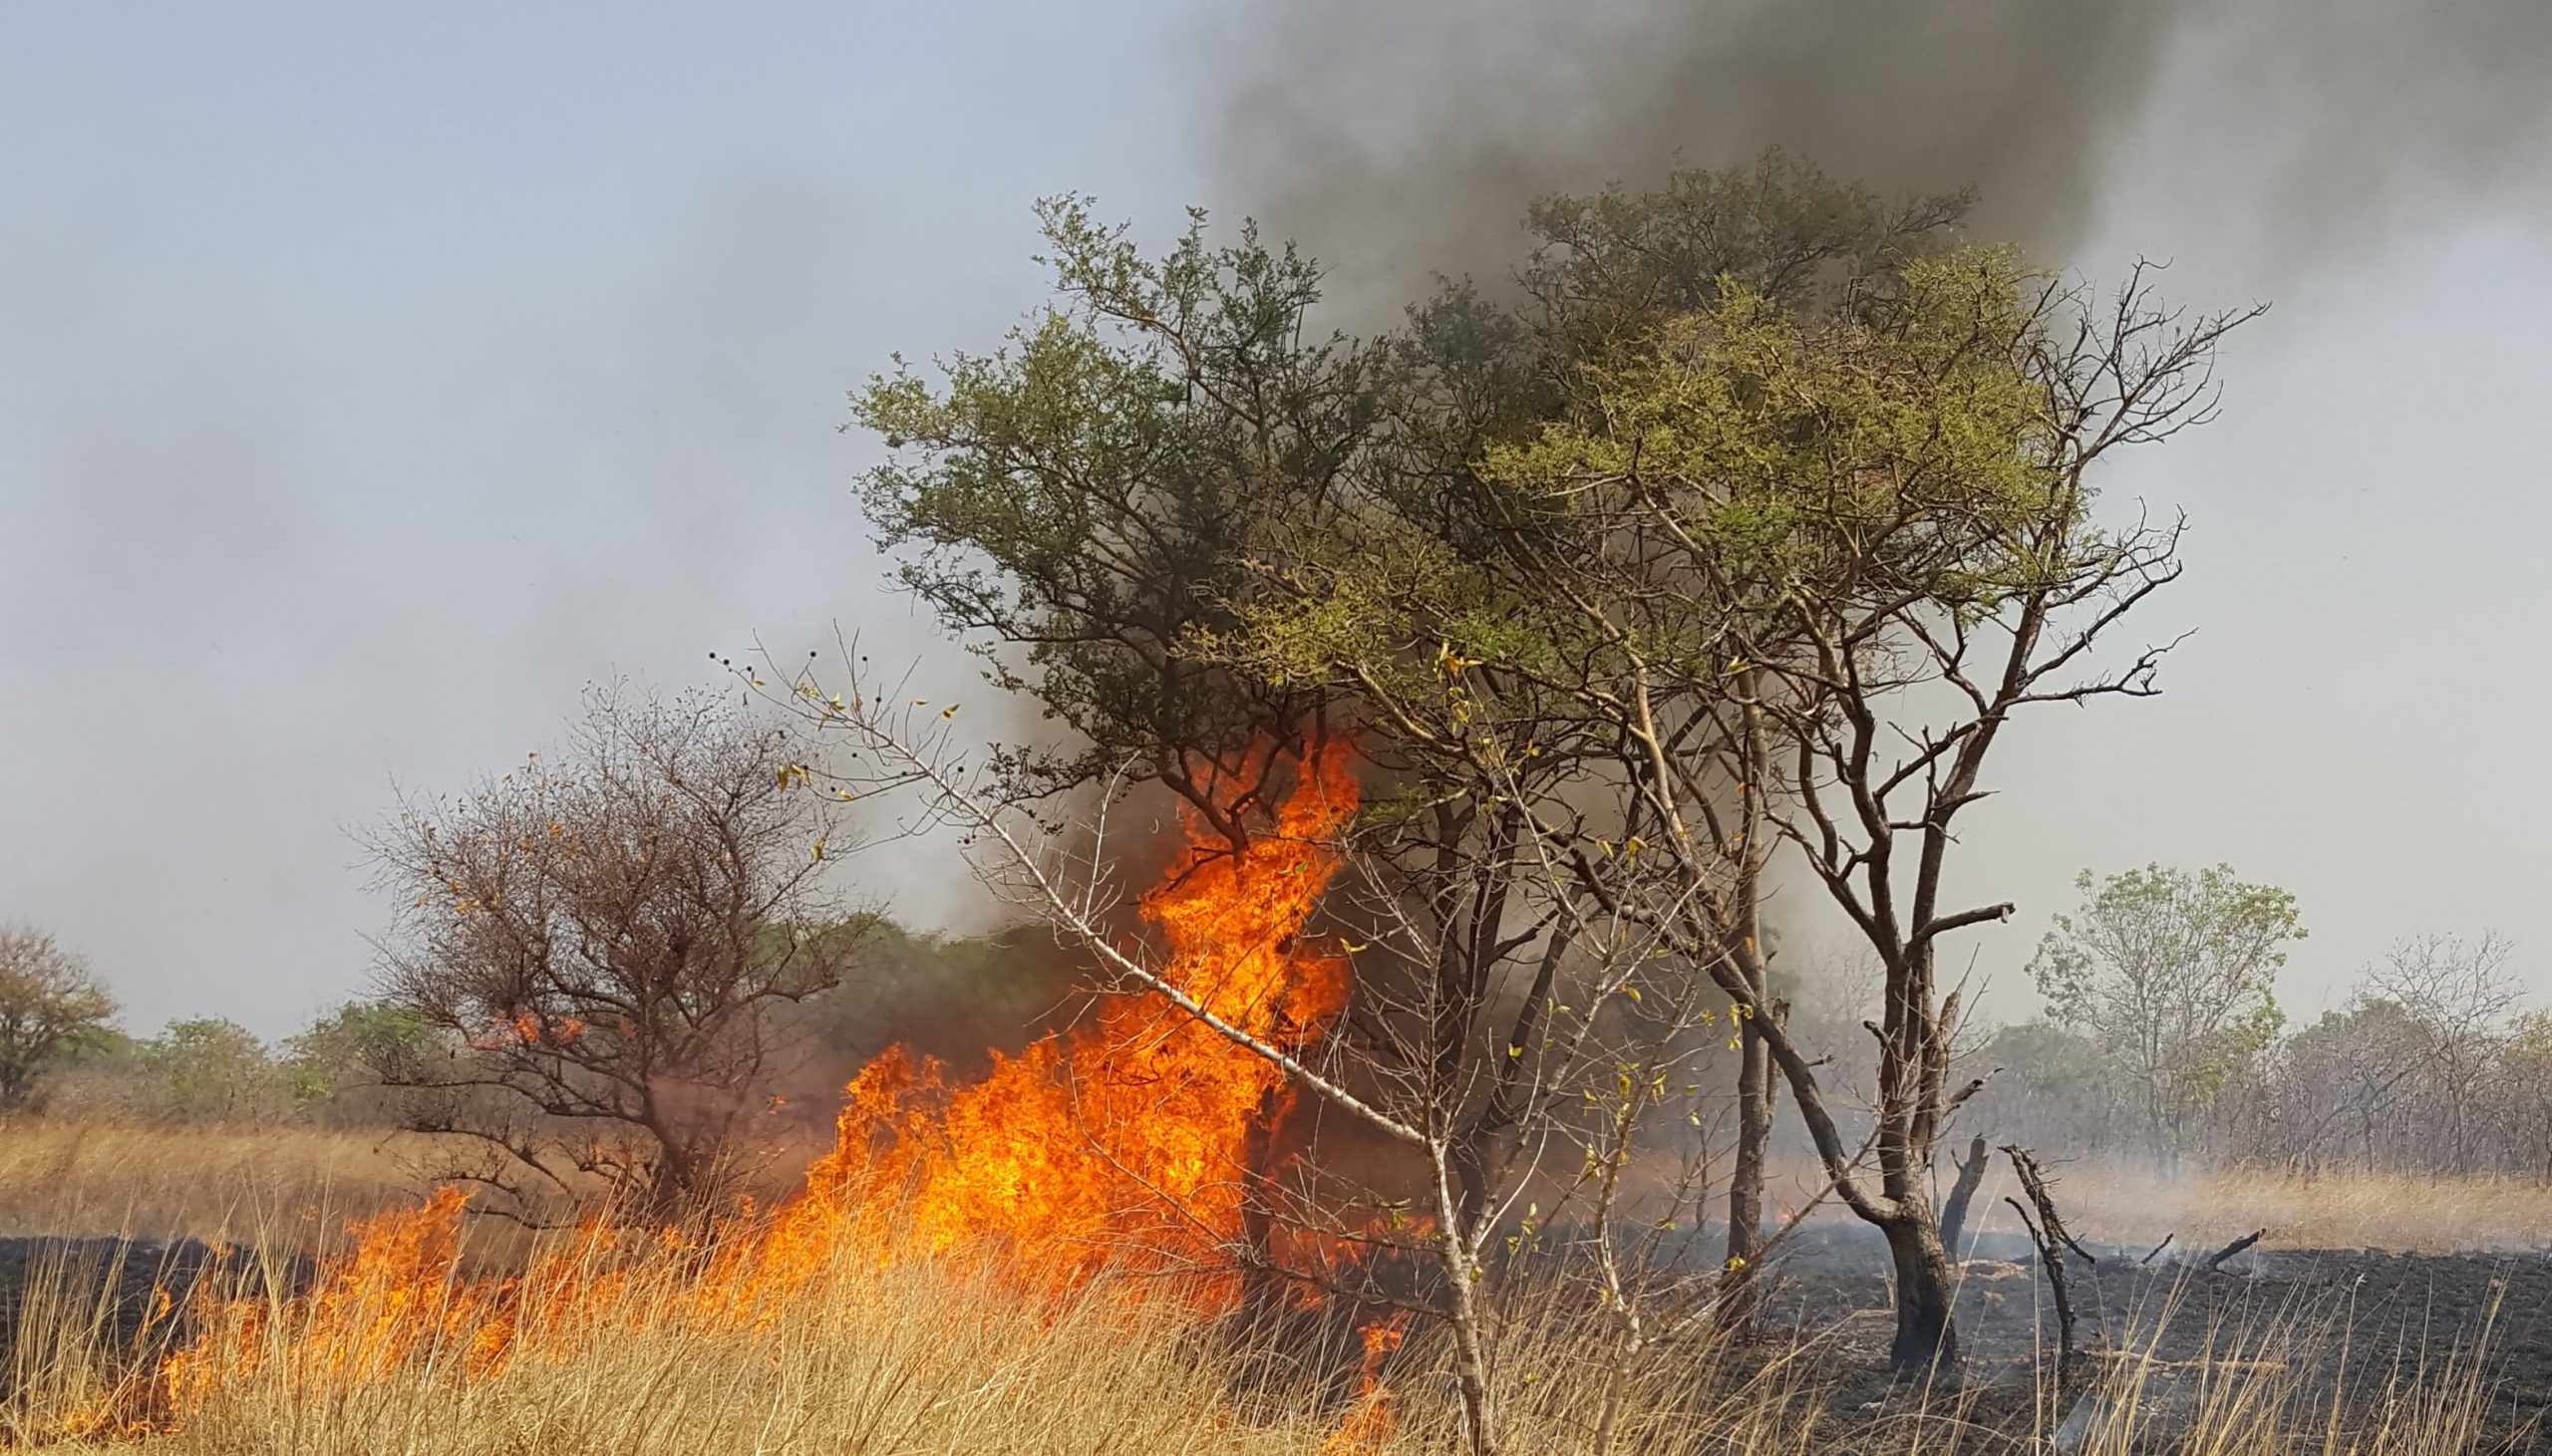
Fire intensity is undisputedly the most commonly used term to describe a fire in the wildfire community. Its formulation is simple, and it is quite easy to understand conceptually. The classical formulation of fire intensity was introduced by Byram in 1959 – that’s why fire intensity or fireline intensity is often called Byram’s fire intensity. Its main variables are the fire’s forward rate of spread and the fuel consumption at the fire front. Together with the vegetation’s heat content, which is more or less constant across vegetation types, its is straightforward to calculate fire intensity. Fire intensity is closely related to many other fire characteristics, such as flame height, tree scorch height, crowning, tree mortality or top-kill, smoke injection height and many others – not least among them the safety of firefighters and civilians. In an ongoing discussion on opportunities to reduce emissions from fires over savannas in Africa and creation of carbon finance that can support conservation and local communities, fire intensity plays a key role.
And yet fire intensity remains elusive and shrouded in mystery. There is no global dataset on fire intensity and there are even relatively few field measurements. This is because it is not easy to measure – neither from space nor from the ground. It is not easy to measure fire rate of spread in the field, and it is also not easy to measure fuel consumption in the fire front. So, what fire managers usually do in the field is to estimate fire intensity from (often visual) estimations of flame length or flame height, or (after the fire) from tree scorch height. Setting up a fire experiment to actually measure fire intensity requires a substantial amount of work, is obviously not permitted or save to do everywhere and at all times, and needs measurement equipment and experience. Most experiments are small in scale, there are extremely few fire intensity measurements over (large) wildfires, measurement methods are quite variable and depend a lot on the budget and instrumentation at hand. Not surprisingly, substantially more information is available on boreal fire behaviour than about the tropics.
Another approach (also implemented in firemaps.net) is to use modelling to forecast fire intensity based on weather variables, fuel information and terrain. But then again, to assess the accuracy of a model, or even to train a model, you need observed data.
What we can see from space
Remote sensing scientists have been looking at the heat release measured through thermal infrared sensors from space and tried to relate it to fire intensity. However, this approach has its difficulties. Although the thermal signal comes in units of power (W) and – if our fire front is long and large enough to be seen by coarse resolution infrared sensors from space – we can relate this fire radiative power to the length of the fire front, we will still end up with something termed “radiative fireline intensity”, which is very much different from fire intensity as fire managers know and appreciate it.
While the satellite observable fire radiative power (FRP) is related to the instantaneous rate of fuel consumption (i.e. kg/s), what is missing in the equation is the rate of spread.
New and upcoming sensors in space offer fresh opportunities to tackle this problem and potentially create a reference database that would give a new look on fire intensity, especially in savanna landscapes. In a recent paper, we describe a concept which is based on combining data from different satellites to both assess fire rate of spread (over a time of a few hours) and fuel consumption, which can then be combined to fire intensity.

An experimental fire in Comoé National Park
How is this done? We use data from the European Sentinel-2 Satellite to identify fire fronts active at the time of the satellite overpass at about 10 in the morning, and assess the distance the fire front moved by comparing to (coarser resolution) data delivered by the US satellites NOAA 20 and S-NPP about two and a half hours later. During this time, the European weather staellite Meteosat keeps taking images of the fire every 15 minutes (at coarse spatial resolution), recording the heat release (FRP) of the fire. This heat release can then be converted to fuel consumption. Combining these two measurements, we get fire intensity. To our knowledge, this is the first time that genuine fire intensity has been measured from space.
However, we have just obtained a small sample of what is going on in the landscape, and Sentinel-2 data are only available every five days. When observing frequently burning landscapes such as African savannas, this approach may still give a sufficiently large sample to characterize fire intensity regimes at landscape level and to gauge remote sensing derived fire intensities against model outcomes or ground measurements. In the light of the ongoing discussion on changing fire regimes in Africa to reduce greenhouse gas emissions, enhance biodiversity and generate carbon revenues, having an actual measure of fire intensity could help testing assumptions that early season burns will be less intensive than late season burns, and thus cause less emissions. Thus, better knowledge of fire intensity may support better decisions in conserving biodiversity and mitigating climate change.
